AIO case study: Rough Country reports 71% more AI referral traffic. How did it measure revenue?

Explore Rough Country’s reported 71% increase in AI referrals and $22,700 in year-to-date AI revenue, with a practical GA4 measurement and reporting workflow.
Visits from AI assistants are rising. Are they producing sales?
That question matters when deciding whether to publish another article, rewrite a product description or improve the path to checkout. A traffic chart alone cannot answer it.
Tinuiti reports that off-road accessories brand Rough Country increased AI referral traffic by 71% compared with the preceding 90 days. The useful part of the case is the connection between measuring AI visibility and measuring what happens after a visit.[1]
This guide separates the reported results from a practical reporting workflow for an ecommerce team. The sample numbers below are fictional teaching examples, not Rough Country's internal data. Product documentation was checked on September 30, 2026.
Rough Country's reported 71% increase in AI referral traffic
Keep three observations separate: appearing in an AI answer, receiving a visit and recording a purchase. They describe different parts of a customer's journey.

What does Rough Country sell?
Rough Country sells off-road parts and accessories. Tinuiti describes a business that had invested in traditional SEO but lacked a clear view of its performance in AI search.[1]
For a store in this category, shoppers might ask whether a part fits a particular vehicle or whether an accessory is appropriate for everyday use. Those are illustrative questions, not quotations from the company's customers.
For an initial investigation at another store, list the conditions people need to check before buying. Product names alone will not capture every decision the page needs to support.
What is the 71% increase compared with?
The comparison is AI referral traffic versus the preceding 90 days. The case does not provide absolute visit counts or the exact start and end dates.[1]
It therefore does not establish monthly growth of 71%, or a 71% increase in all website traffic. Preserve both the channel and the comparison period when discussing the result.
In an internal report, place absolute counts beside percentages. Ten visits increasing to twenty and one thousand increasing to two thousand are both 100% increases, but their operational implications are different.
What does the $22,700 in AI-attributed revenue cover?
Tinuiti reports $22,700 in revenue from AI sessions year to date. That is approximately ¥3.59 million using an illustrative conversion of ¥158 per dollar, rather than a live exchange rate. The calendar year, reporting cutoff and detailed attribution configuration are not specified.[1]
Do not turn that cumulative figure into monthly revenue. For a store's own reporting, keep order-system revenue, GA4 purchase revenue and the portion associated with the selected AI traffic classification in distinct fields.
Naming the source and scope of each amount makes it much easier to explain differences in a review meeting.
How do AI visibility and sales differ?
An AI answer mentioning a brand is not itself a website visit. A visit is not itself a purchase. Record the stage actually observed.
| Question | Evidence to retain | What it does not establish |
|---|---|---|
| Did AI mention the business? | Prompt, date, answer and cited page | Website traffic |
| Did a visitor arrive? | Sessions classified as AI referrals | Every visitor's reason for buying |
| Was a purchase recorded? | Purchase count and revenue | Incremental revenue caused solely by AI work |
Even when the reporting period matches, these measures have different denominators. Do not report answer visibility as a purchase conversion rate.
Three parts of Rough Country's AI search work
The published work covers observing AI answers, connecting referrals to revenue and improving product information.[1] These are also useful categories for assigning work within a store team.

Measure answers for specific customer questions
Tinuiti describes using Profound to examine more than 180 high-intent prompts across seven models. The full prompt set and execution settings are not public.[1]
A smaller store need not treat that scale as an entry requirement. An initial set can cover product uses, comparisons and purchase conditions.
For a camping store, illustrative questions might concern a compact tent for a car trip, differences between wet-weather tents and the availability of replacement poles. Save the wording and reuse it when checking again.
If a question changes, add a new record instead of replacing the old one. Otherwise a different question can look like a change in AI performance.
Connect AI referrals to revenue in Google Analytics
The case describes Google Analytics and Looker Studio reporting, but does not publish the exact report configuration.[1] The workflow later in this guide is an independent practical proposal.
Start with a table that shows the reporting period, traffic classification, sessions, purchase measures and purchase revenue together. Complexity can come later if the team needs it.
Give the report a descriptive name, such as “Domestic store: AI referral comparison,” and display the date range above the table. A label such as “AI performance” leaves too much room for interpretation.
Improve product descriptions and FAQs
The case includes work on product information and answers to common questions. It does not publish a complete before-and-after manuscript for an individual product page.[1]
For a store's own experiment, pick one purchase question and check whether the page answers it. Replace vague descriptions with verified details about fit, dimensions or included accessories where those details matter.
For example, a carrying bag appearing in a photograph does not establish that it is included. Check the package contents and state the answer in text. Then compare the photograph, description and specification table for consistency.
Does adding llms.txt explain the result?
The case combines several activities, so it cannot isolate the effect of one file.
Google says its AI search features do not require additional AI-specific files or special structured data. Its guidance continues to emphasize the fundamentals of accessible, useful content.[5]
With limited time, a team can first investigate missing purchase measurement, incomplete product details and outdated prices. Installing a file does not, by itself, create a usable sales report.
Start measuring AI search outcomes in GA4
The following steps are based on official GA4 documentation. They have not been tested against a reader's store. Report navigation can differ according to the property's configuration.
Confirm the property and purchase measurement
Sign in to Google Analytics and select the store's property. If the account includes several stores or test environments, confirm the website as well as the property name.
Check purchase revenue for a period with known orders. If orders exist in the store system but purchase measures are absent in GA4, investigate ecommerce measurement first.
Ask the implementation owner to confirm purchase events, currency and value, and possible duplicates. A reporting user should not add another tag simply because the cause is unclear.
Record the property, a period with purchase data and the person responsible for measurement. That helps distinguish a genuine zero from missing instrumentation.
Open Traffic acquisition and locate AI traffic
In Reports, open Traffic acquisition. In a standard Life cycle collection, it appears under Acquisition; other configurations may organize reports differently. If it is missing, ask the property's administrator about the published report collection.[2]
Use session-scoped dimensions for the current visit. A user's original acquisition source and the source of a later session answer different questions.[3]
- Select a completed period with available data.
- Check the table's current dimension, such as Session default channel group.
- Locate AI Assistant if it is present and inspect sessions and purchase revenue.
- Switch to Session source / medium to investigate individual sources.
Save the period and dimension name alongside the results. Values copied without their labels are difficult to audit later.
Use AI Assistant and source dimensions for different questions
Google announced an AI Assistant channel on May 13, 2026, for recognized AI referrers. It does not reveal every purchase in which AI played a role.[4]
Use the channel for an overall view and source dimensions for service-level detail. Where both tables describe the same sessions, do not add their totals together.
Do not reclassify unattributed visits as AI traffic based on a hunch. Save the standard classification first. If a custom classification becomes necessary, document the included sources, change date and reason.
Read sessions and purchase revenue together
Sessions describe visits, not unique people. Place visit measures beside purchase measures while retaining their exact names.[2]
Also check what a key event represents. A signup or enquiry may be configured as a key event; its count should not automatically be described as purchases.
Avoid copying every outcome into a column called “conversions.” Use labels that identify the actual event and revenue measure. If a needed column is unavailable, ask the administrator about permissions and report customization.
The first deliverable is a table whose visits and purchase outcomes share the same scope and period.
Compare AI traffic over equal 90-day periods
The comparison below is a proposed workflow for a store. It does not claim to reconstruct unpublished Tinuiti reporting settings.
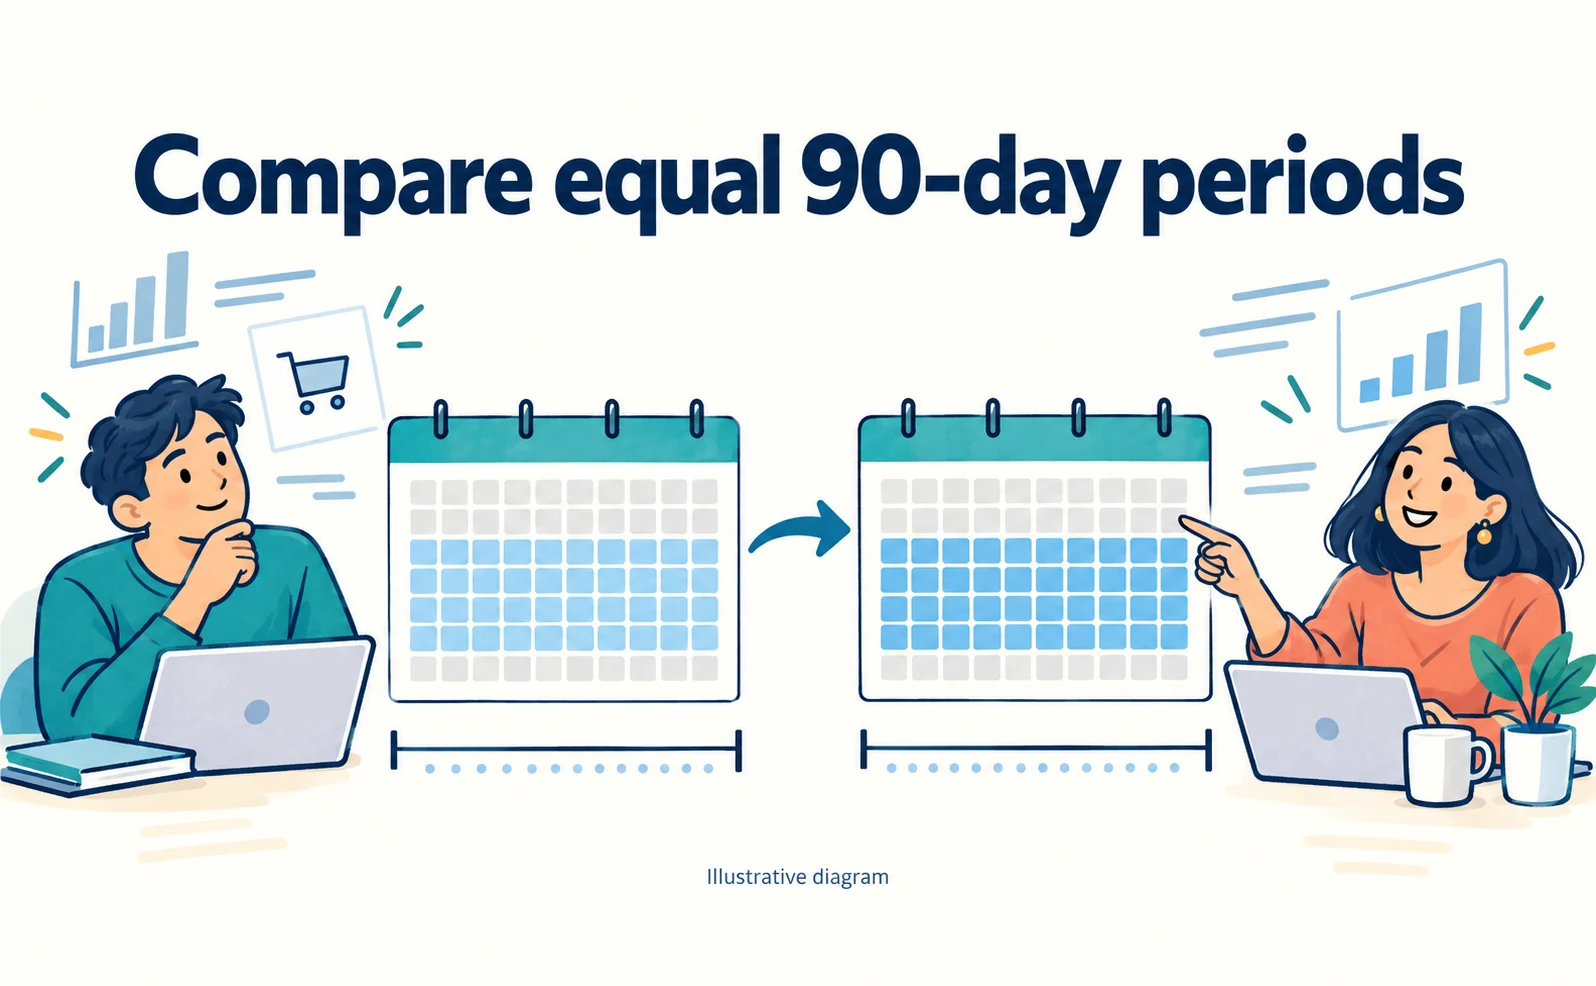
Choose the latest 90 days and the preceding 90 days
Use a completed day as the endpoint. Comparing a partial current day with a full historical day introduces a timing difference.
For a report prepared on September 30, one option is the 90 days ending September 29 and the 90 days immediately before them. Verify the actual dates in the date selector. Ninety days is not necessarily the same as three calendar months.
Keep the property's time zone consistent and record any change. Use the same range for the traffic and revenue tables, and include the dates in the saved report's filename.
Show absolute changes beside growth rates
Calculate growth as the difference between the current and previous values divided by the previous value. In a spreadsheet with the previous value in B2 and the current value in C2, use =(C2-B2)/B2 and percentage formatting.
These are fictional numbers for illustration:
| Measure | Previous 90 days | Latest 90 days | Change | Growth |
|---|---|---|---|---|
| AI-attributed sessions | 200 | 300 | +100 | +50% |
| Purchases | 4 | 5 | +1 | +25% |
| Purchase revenue | ¥40,000 | ¥60,000 | +¥20,000 | +50% |
If the previous value is zero, report “0 to 3 purchases” rather than dividing by zero. If measurement was absent, record “not measured,” not zero. Confirm that both periods use the same traffic classification.
Record sales promotions, measurement changes and stockouts
Keep a dated record of events that could affect the comparison: promotions, advertising changes, prices, stock availability and measurement updates.
Higher traffic with a best-selling item out of stock may produce a different purchase pattern. A major sale can also overlap with a content edit. Neither observation establishes that the edit alone caused the result.
| Date | Item | Example record |
|---|---|---|
| Actual date | Product A | Added compatible sizes |
| Actual date | Entire store | Ran a weekend promotion |
| Actual date | GA4 | Corrected duplicate purchase events |
Use the record to choose follow-up investigations, rather than to assign a cause automatically.
Explain months with few purchases
When purchases are sparse, lead with counts and amounts. One high-value order can change a monthly growth percentage substantially.
Imagine a month with one ¥5,000 order followed by a month with two orders totaling ¥50,000. Revenue is ten times higher, but the purchase count has only doubled. These are hypothetical figures.
A clear report would explain the increase in orders and the contribution of a higher-value product separately. Observe a longer period before treating the growth rate as a stable forecast, and check whether results depend on a single product or transaction.
Choose the next page improvement from traffic and sales
Measurement should help the team decide what to inspect or change next. Use the combination of visits and purchases to choose that work.

When AI visits increase but purchases do not
First inspect the landing pages and the route to a relevant product. More visits to an informational article do not necessarily indicate a problem with the product description.
Open the page on a phone and follow its links. Check the destination product, current price, availability, delivery information and purchase button. Look for discontinued products or links to the wrong variant.
For direct product visits, ask whether the page answers the visitor's likely condition. A shopper looking for a lightweight desk still needs its weight.
Limit the next change to a specific page and task, such as making article A's route to product B clearer. Record what changed before expanding the work.
When both AI visits and purchases are low
Check measurement before assuming that the content is the only problem. Revisit the property, period and traffic classification.
If purchases are not being recorded across the store, resolve that with the measurement owner. If measurement works but recognized AI referrals are limited, select a page that can answer a concrete purchase question.
Useful candidates include products with frequent enquiries, reliable specifications and continued availability. Define the reader, question and destination URL. That produces a clearer task than a target number of articles alone.
Read the product pages associated with purchases
Look for useful information on pages associated with purchases: uses, dimensions, materials, compatibility, included items and delivery details.
The relevant fields depend on the product. Clothing needs sizing information; vehicle parts need compatibility information. Copying a successful page's structure without adapting those details can produce irrelevant content.
Treat recurring features as hypotheses for another page. Price, stock and brand familiarity may also influence purchases, so a shared heading is not proof of a causal effect.
Record the edit date and display-check date
Saving a draft and publishing it are different events. Record the URL, change, publication date, reviewer and next reporting date.
| URL | Change | Publication | Display check | Next review |
|---|---|---|---|---|
| Product URL | Added included items and compatible sizes | Actual date | Desktop and phone | Reporting date |
Retain the previous wording so an unexpected problem can be reversed. Check the public page rather than just the editor. Fix broken links, overflowing tables and mismatched variant information before calling the work complete.
What to include in a monthly AI search report
Combine the numbers, completed work and next investigation in one report. Keep visits, purchases and revenue individually readable.

A template for traffic, purchases and revenue
Copy these fields into a spreadsheet. Use “unconfirmed” or “not measured” where a value is unavailable.
| Field | What to record |
|---|---|
| Scope | Store and GA4 property |
| Period | Current and comparison dates |
| Classification | Session channel and source conditions |
| Visits | Sessions and change |
| Purchases | Event or measure, count and change |
| Revenue | Purchase revenue, currency and change |
| Completed work | URL, edit and publication date |
| Other events | Promotions, stockouts and tracking changes |
| Next task | Target, owner and deadline |
Using the hypothetical table above, report sessions moving from 200 to 300, purchases from four to five, and purchase revenue from ¥40,000 to ¥60,000. Preserve the measure names instead of compressing them into a single “AI growth” claim.
When order-system revenue differs from GA4
Align the scope first. All store orders will not match revenue for one selected acquisition channel.
If the intended scope matches, investigate dates, refunds, tax and shipping treatment, currency and unmeasured orders. Do not overwrite one figure with the other merely to remove the discrepancy.
Give the implementation owner the period, channel, two compared amounts and included components. Decide internally which system is authoritative for accounting or fulfilment and which is used for traffic analysis. Label each figure with its source.
Explain results and unresolved questions to a manager
Separate the observed change, completed work and next investigation. For example:
AI-attributed purchases increased from four to five. We updated products A and B, but a promotion ran during the same period, so we have not isolated the effect of those edits. Next we will inspect purchasing landing pages and stock availability.
This is a sample report, not a quotation from a real company. Replace the numbers and activities with verified information before using it.
Assign an owner and a date to unresolved questions. That turns an uncertainty into a follow-up task.
Keep the same conditions next month
Duplicate the previous report and update its period and figures. Check that classifications, measures and target pages remain comparable.
If conditions change, preserve both versions. Recalculate past data consistently where possible; otherwise mark the change date as a break in the series.
Also check whether the page improvements agreed last month were actually published. If work stalled, resolve the missing owner or source material before interpreting unchanged results.
The practical starting point is one report that consistently connects recognized AI visits with purchases and revenue. Use it to select the next page worth improving.
FAQ
- Q. Does more AI traffic mean the same percentage increase in revenue?
- No. Record visits, purchases and purchase revenue separately. If purchase tracking is missing, label it unavailable rather than reporting zero revenue.
- Q. Is the reported $22,700 monthly revenue?
- No. The source describes year-to-date AI-attributed revenue. It does not clearly specify the year or reporting cutoff for that figure.
- Q. Should I add AI Assistant channel totals to referral-source totals?
- No. They may describe the same visits from different dimensions. Review the channel total and source breakdown separately.
- Q. What should an early AIO report include?
- Show counts before percentages, with dates, measurement conditions, completed changes and unresolved questions. Identify the next page to improve and why.
Sources
- [1] Turning AI Search Into a Revenue Generator (Tinuiti) — accessed 2026-09-30
- [2] Traffic acquisition report (Google) — accessed 2026-09-30
- [3] Scopes of traffic-source dimensions (Google) — accessed 2026-09-30
- [4] May 13, 2026: AI Assistant traffic measurement (Google) — accessed 2026-09-30
- [5] AI features and your website (Google Search Central) — accessed 2026-09-30
About the author
Shogo MizushimaCEO of kairos Inc. / AgentSignal Developer
Develops AgentSignal, a tool for measuring AI crawler visits and AI-referred traffic, and diagnosing AIO readiness. Writes about measurement and practical improvements for AI search using observed data.
Related articles

AIO and AI search
AIO case study: Mito Red Light reports 200% growth in monthly AI revenue. Improve product information first
Understand Mito Red Light’s reported 200% monthly AI revenue growth, then improve product descriptions, specifications and FAQs with a Shopify review workflow.
Published

AIO and AI search
LLMO case study: JDM reports 34% agency revenue growth. What did it sell to clients?
Learn from JDM’s reported 34% agency revenue growth: how to define LLMO research, page-edit deliverables, costs and monthly client reporting.
Published
AIO and AI search
How to Build LLMO Comparison Pages: 1840 & Co's Reported 0% to 11% AI Visibility
Examine 1840 & Co's reported AI visibility result, then build a comparison page with consistent criteria, documented evidence, and repeatable observation.
Published