How to Use Recordings and Heatmaps to Find Website Improvements
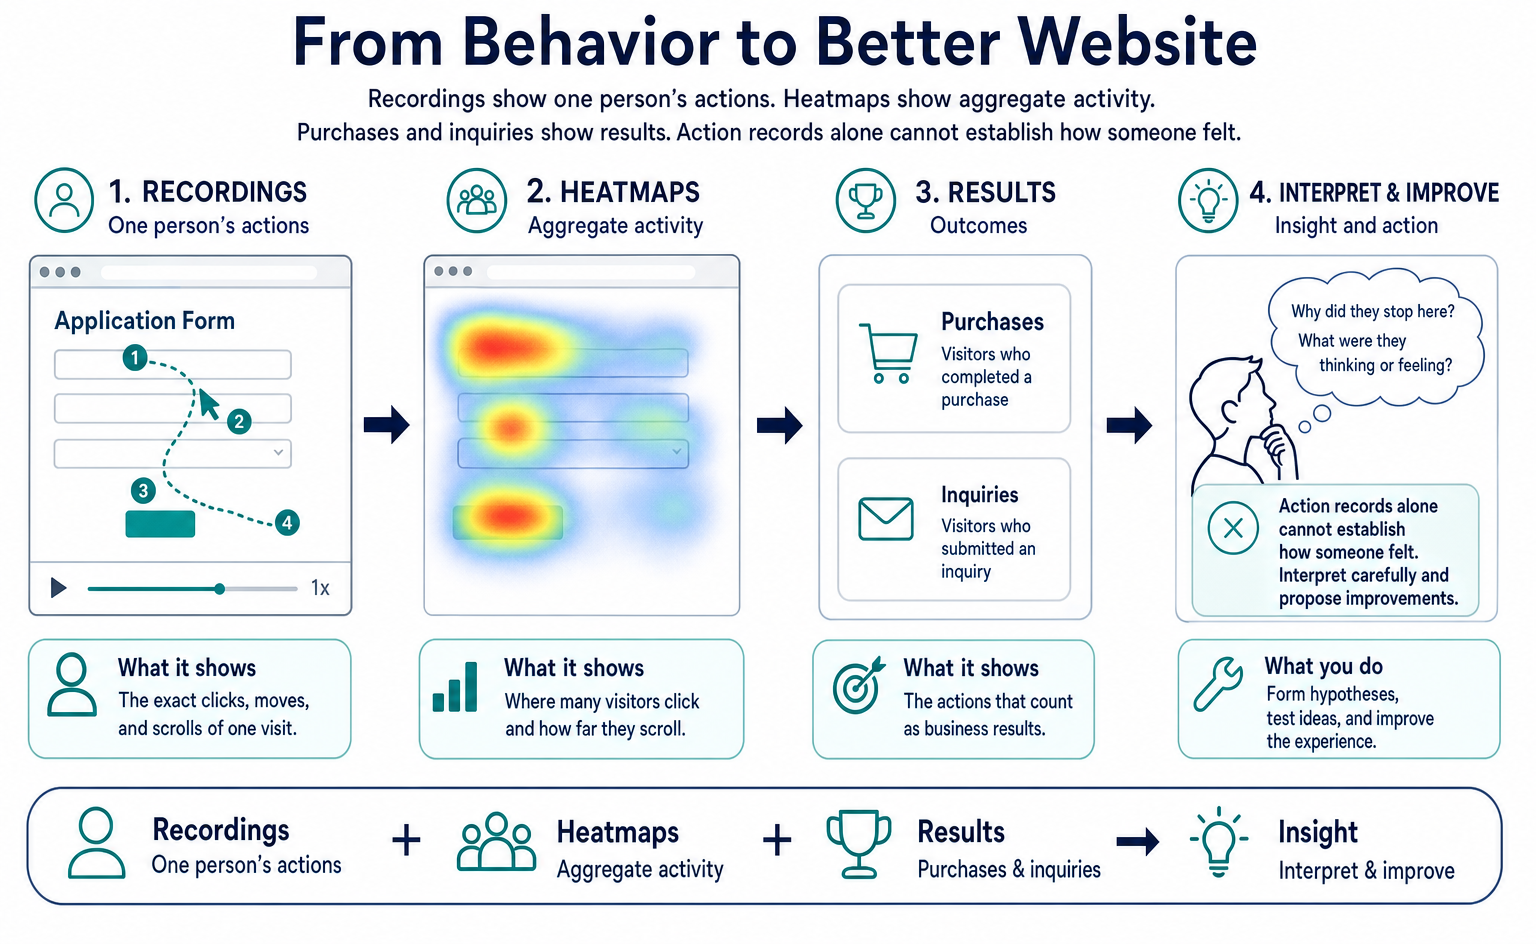
Replay visitors’ page activity and filter by page, device, and date. Learn to read the recording list, review clips around conversions, and use heatmaps and error logs. Includes tips for separating observations from assumptions, sharing safely, and troubleshooting playback.
Web Recordings lets you replay what visitors did after opening a page. Start by filtering for the page or period you want to investigate, then watch recordings that interest you. Heatmaps show an overview of frequently clicked areas and how far visitors scrolled.
People reach your application form but go no further. You know how many visits you get, but not which screen to improve. In that situation, do not start by playing every recording. Narrow the list to visits that opened the form. Set a small starting scope, such as watching three recordings.
Recordings show actual actions. You still need to interpret the records to understand why someone stopped or how they felt. The screen examples below use sample data. When reviewing your own recordings, separate what you observed from your proposed explanation.
1. The nine items in the recording list
Under Web Recordings & Improvements (Web録画 & 改善) → Web Recordings (Web録画) (/recordings), each row represents one visit. This group of activity is called a “session.” Start by checking the time, page, device, and whether a recording can be played.
Try the interactive demo below. The article also explains each step in text.
| Column | Meaning | Review tip |
|---|---|---|
| Start time (開始時刻) | Time of the session’s first event | Repeated late-night visits are often bots or AI agents from overseas |
| Duration (長さ) | Time between the first and last events | A few seconds with one page view suggests the visitor opened the page and quickly closed it. Rows with a duration near zero are often bots |
| PV | Number of pages viewed during the session | Many page views without a conversion may indicate that someone searched but did not find what they needed |
| Landing page (ランディング) | Host and path of the first page opened | Click to filter with Show only this URL (この URL だけ表示) |
| Referrer (リファラー) | The site visited immediately beforehand, from the Referer header [5] | chatgpt.com or perplexity.ai indicates a visit from an AI answer |
| Device (端末) | Desktop, smartphone, tablet, or bot icon | Click to open details about the operating system, browser, and device model |
| Type (種別) | Human, AI agent, or bot | The three categories explained in section 2 |
| Results (成果) | Whether there was a conversion (CV), among other results | Rows with a conversion are especially worth replaying |
| Play (再生) | Play button at the right edge | Disabled for rows without a recording, such as bot visits |
To investigate visits from AI, check Referrer (リファラー) and Type (種別). The referrer identifies the site visited immediately beforehand. If information such as chatgpt.com is retained, you can identify a visit from an AI service.
However, some visits do not retain their source information. You cannot identify every AI-origin visit among those marked “Direct” in tools such as GA4. Classify visits based on the information available.
Click the device icon to see details such as operating system, browser, manufacturer, and model. An operating system, or OS, is the basic software that runs a device, such as iOS or Windows. A user agent is a text string that a browser or other software uses to identify its type.
For example, if you suspect a layout issue occurs only in Safari on an iPhone, pass those details to your developer. You can share the displayed information as it is, rather than trying to interpret the technical text yourself.
The following four patterns can help you choose recordings to watch. A long visit does not necessarily mean someone is struggling. Find candidates first, then review their actual actions.
| Pattern in the list | How to read it |
|---|---|
| At least 4 minutes, at least 5 PV, no CV | The visitor may have been searching. Replay their actions on the final page |
| Less than 10 seconds, 1 PV | An exit immediately after landing. The landing page may not match the referrer |
| AI service referrer, human type | A person who followed a link from an AI answer. Relevant when assessing efforts to improve visibility in AI search |
| AI agent type, at least 3 PV | AI acting on a person’s behalf. You can see which pages it viewed and where it stopped |
Click the play button to open the player on the right side of the list. Drag the divider to change its width. You can also move to the previous or next recording from within the player.
This lets you compare several recordings while keeping the same list filters. After watching, make a short note of the page or action where activity stopped. Keep the time and other identifying details so you can find the recording again.
2. Types of visits that are recorded
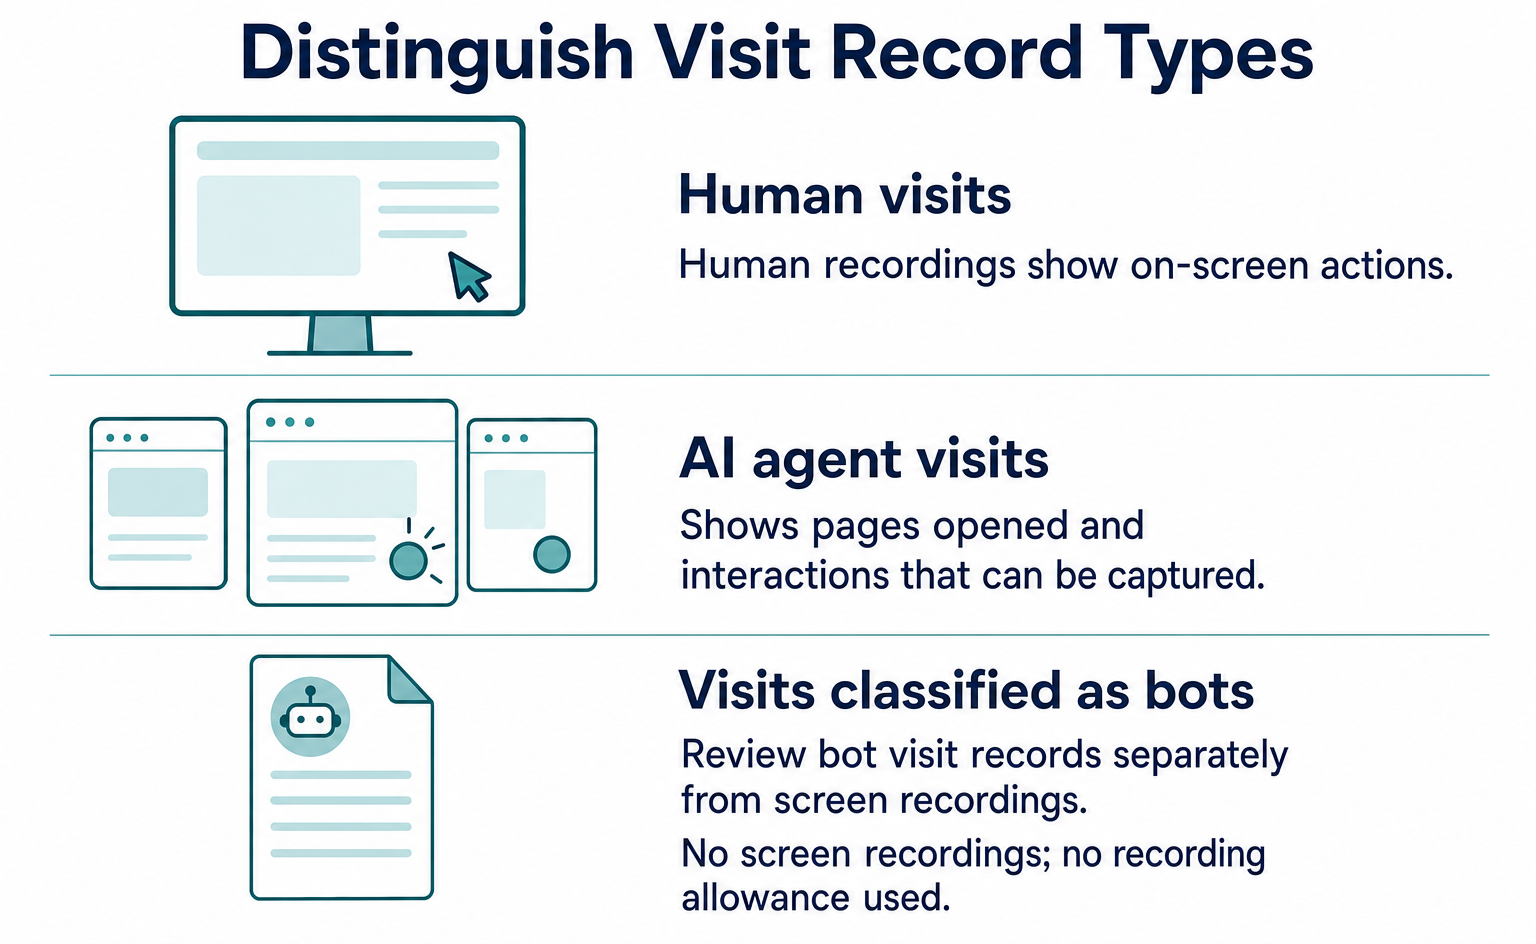
Visits are displayed as human, AI agent, or bot. This classification determines whether a visit is recorded and whether it uses your allowance.
Try the interactive demo below. The article also explains each step in text.
An AI agent is AI that operates pages at a person’s request. Like human visits, its visits are recorded and use the allowance. Bots include crawlers that collect pages and programs that monitor sites. Visits classified as bots are not recorded and do not use the recording allowance.
AI agent recordings show which pages the agent opened and what it interacted with. The behavior you want to investigate differs from that of a crawler that simply collects pages.
Not all bots run on AI. Check the type rather than treating every visit with an AI-related name as “an AI visit.” For the roles of different crawlers, see AI crawlers and robots.txt explained.
Classification is automatic. However, browsers used for automated testing and visits routed through a company network may be classified as bots.
If a page you opened yourself is not recorded, set Type (種別) to Bot and look for a record with the same time and URL. Distinguish between a visit that is missing entirely and one recorded as a bot visit.
3. Filter for the recordings you want
Combine conditions such as page, date range, and device to find the visits you want to investigate. There are two rows of filters above the list. Open Advanced filters (詳細フィルター) for more conditions.
| Location | Condition | When to use it |
|---|---|---|
| Row 1 | URL: exact or partial match for the landing URL | Only people who landed on /pricing |
| Row 1 | Device (端末): desktop, smartphone, tablet, TV, game console, or Bot | Investigate exits on smartphones only |
| Row 1 | Period (期間): past 24 hours, 7 days, 30 days, or custom dates | Compare before and after a change |
| Row 1 | With conversions (CV あり) | Only people who signed up |
| Advanced | Type (種別): human, agent, or Bot; Via AI (AI 経由); Provider (プロバイダ) | Only visits from AI |
| Advanced | Referrer (リファラー), such as chatgpt.com | Only people from a particular AI service |
| Advanced | OS, Browser (ブラウザ), Manufacturer (メーカー) | Check an issue that occurs only in Safari on iOS |
| Advanced | User ID (ユーザー ID), CV name (CV 名), Custom event name (カスタムイベント名) | When identify, CV tags, or custom events have been set up |
| Row 2 | Result count (件数表示), Clear (クリア), Export CSV (CSV 書き出し) | Export filtered results as CSV for a report |
First consider “whose visit,” “which page,” and “what action.” These are three guides for choosing conditions. For example, to investigate people who opened a form on a smartphone, specify both the device and URL.
A CV, or conversion, is an action registered as a business result, such as a purchase or application. Select With conversions (CV あり) to see visits where that action was recorded. First confirm which actions have been registered as conversions.
You can search URLs by partial text or select only an exact URL. Entering “/pricing” in the top input field finds pricing pages and other URLs containing that text.
Landing page (ランディング) is the first page opened. Click its link to display only visits that started at the same URL. Depending on your investigation, check whether you also need to include people who reached the pricing page through another page.
As a starting rule, add conditions if there are more than 100 results, and broaden them if there are only 0–2. Narrow the list to about 10–30 results, then watch 3–5 recordings first.
These are only starting guidelines. Even if three recordings stop at the same place, that alone does not establish the cause for all visitors. If you find a common action, check other recordings and aggregate data too.
The following examples show how to choose conditions based on your question. Use the available filter fields to get close to the conditions shown, then check the remaining information in the list or player. Replace the dates and URLs with those relevant to your site.
| # | Question | Combination | What to check |
|---|---|---|---|
| 1 | Do people arriving from AI sign up? | Via AI × With conversions × Past 30 days | Duration and PV from landing to conversion |
| 2 | Where do people arriving from AI leave? | Via AI × No conversions × At least 2 PV | Last page viewed |
| 3 | Why do people abandon the form? | URL = form page × No conversions × At least 30 seconds | Field where input stopped |
| 4 | Why are smartphone results worse? | Device = smartphone × URL = landing page × Past 7 days | Horizontal scrolling and difficulty pressing buttons |
| 5 | Does the ad lead to the right page? | Referrer = advertising platform × Less than 10 seconds | Exits immediately after landing |
| 6 | What are AI agents doing? | Type = agent × Past 7 days | Page order and actions |
| 7 | What did a particular customer do? | User ID = relevant ID | Connections across multiple sessions |
| 8 | What changed after an initiative? | Keep the same conditions and change only the period | Changes in conversion rate and exit pages |
In example 3, “at least 30 seconds” is a guideline for excluding visits that ended immediately. A page being open for 30 seconds does not prove that someone was entering information. Check the recording for form interactions.
Examples 1 and 2 are starting points for comparing people who arrived from AI and signed up with those who did not. Even if you begin with three recordings, keep the findings as examples of observed actions, not as results for the entire audience.
You can export the list as CSV, a format that opens in spreadsheet software. Include the filters and date range alongside the exported numbers in your report.
4. Play a recording
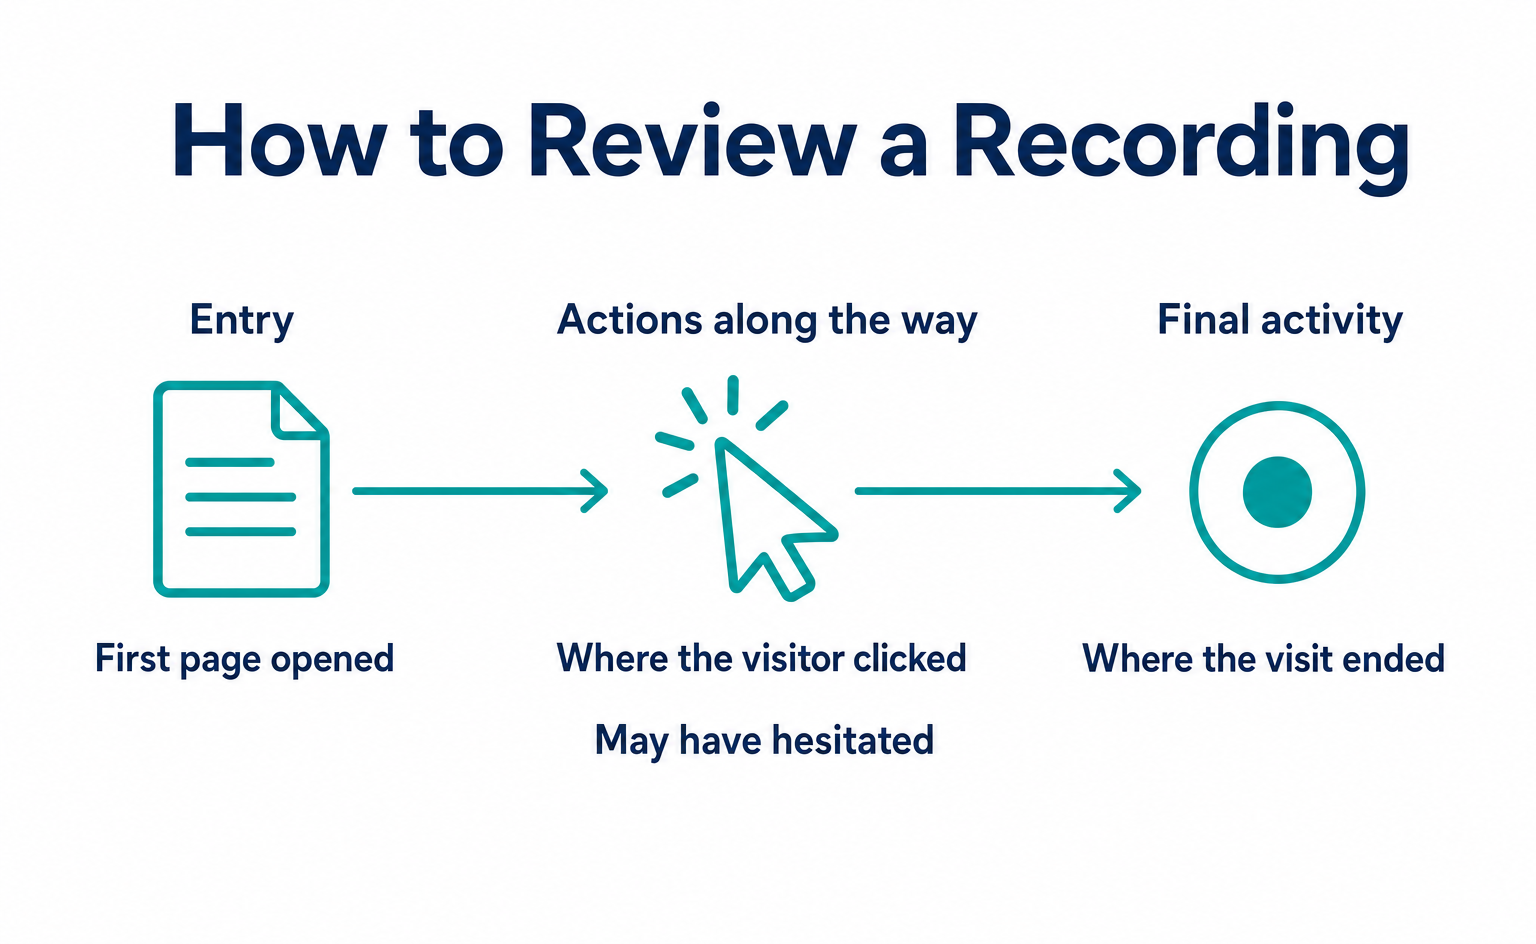
You can play, pause, change speed, and jump to a particular time. On the right, clicks, page changes, and other events appear in the order they happened. This is the “timeline.”
Click an item in the timeline to jump to that moment. Even in a 20-minute recording, you can start with the part you need, such as just before the visitor pressed Submit.
One approach is to watch the overall flow at a faster speed, then pause at points of interest. To see what happened around an action, go back to just before it. Check not only the moment activity stopped, but also what the visitor opened before reaching that point.
You can create a sharing link to show a recording to someone else. Recipients can open it without logging in to AgentSignal. If the shared recording is password-protected, they must enter the password.
Include the time and action you want the recipient to review. “Please check what happens after the submit button is pressed” makes the relevant part clearer than simply saying, “Here is the recording.”
Review the recording itself before sharing. Names and on-screen information that have not been hidden will also be visible to the recipient. Changes under Settings (設定) → Privacy (プライバシー) do not apply retroactively to past recordings.
Creating a sharing link does not extend the recording’s retention period. Review recordings you need while they are still available. Do not present the link to recipients as something they can access indefinitely.
Recordings use a system called rrweb [4]. Rather than filming the screen as video, it records and reconstructs the page’s structure and changes. This makes it possible to hide entered values and other content when recording.
You do not need to understand this system in detail to use the player. Check how the areas you chose to hide actually appear in a recording.
The following five notes can help when preparing a report. For each recording, put the observed actions and your proposed explanation in separate fields.
| Item | What to write | Example |
|---|---|---|
| Conditions | Filters used to find the recording | Via AI × No conversions × /pricing |
| Stopping point | Last page and element viewed | Plan comparison image on /pricing |
| What happened | Actions visible in the timeline | Clicked the image 3 times → went back → left |
| Hypothesis | A one-sentence explanation | The image looks like a button |
| Action | One thing to do this week | Add a “Compare plans” button below the image |
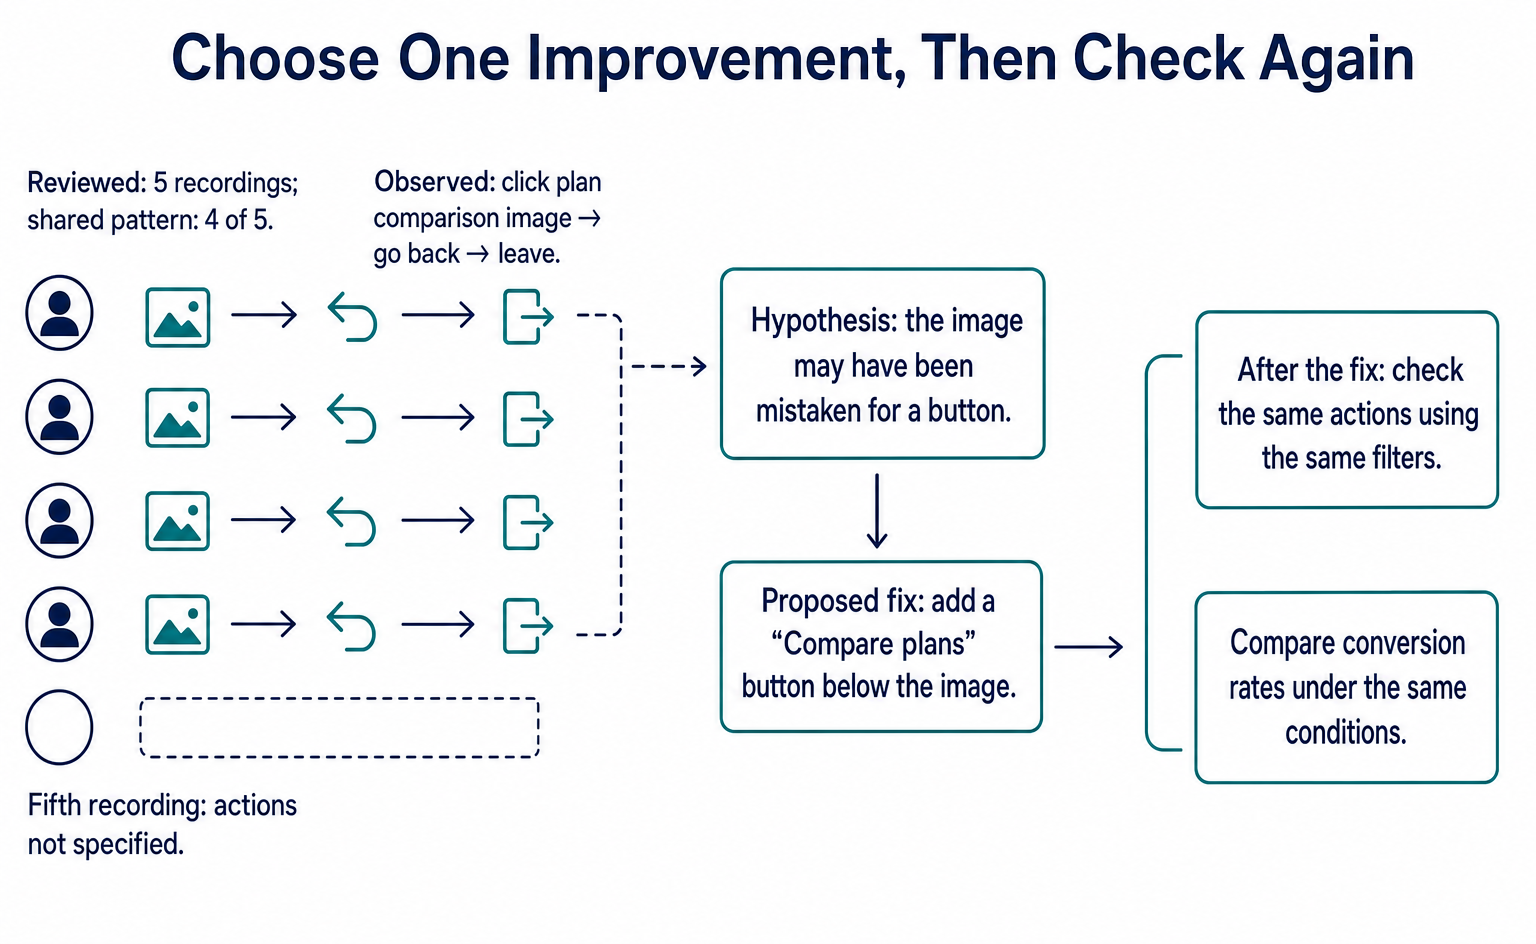
For example, after watching five recordings, compare them for similar actions at the same location. Before choosing one area to fix this week, also check how many people it affects and whether the issue can be reproduced.
A hypothesis can be one sentence, such as “The visitor may have mistaken the image for a button.” Until the reason is confirmed, avoid stating what the visitor thought as a fact. Note what else you need to check.
5. Watch a visit live
Under Web Recordings & Improvements (Web録画 & 改善) → Live Recordings (ライブ録画) (/recordings/realtime), you can view pages that visitors currently have open. This serves a different moment of use from reviewing saved recordings later.
Examples include checking activity just after a launch or distribution, and helping visitors on the spot. Immediately after a campaign starts, you can check whether visitors can press buttons. You can also start a chat while watching live.
If someone stops interacting with a form, you do not yet know why. Ask, “Is there anything you’d like help with?” and wait for their response before offering guidance. Do not assume they are struggling simply because they have stopped.
These four situations are examples of when to watch live. Assigning someone to check immediately after launch makes it easier to respond if a problem appears.
| Situation | What to watch | What you can do at the time |
|---|---|---|
| Just after ads start running: the first hour | Whether arrivals stop on the first screen they see | Fix a mismatch in the destination page or copy that day |
| Immediately after an email send | Where the influx of visitors goes | Improve pages with weak navigation that day |
| When someone stops on a form | Which field they have stopped at | Start a chat and resolve the issue on the spot |
| When an AI agent visits | Which pages it opens and in what order | Note the page where it stops as a candidate for improvement the next day |
The number of visits you can watch simultaneously depends on your plan. Live viewing has a separate subscription and allowance from Web Recordings. Having recording capacity left does not necessarily mean you have the same amount of live viewing capacity.
6. Review the moments around a purchase or inquiry
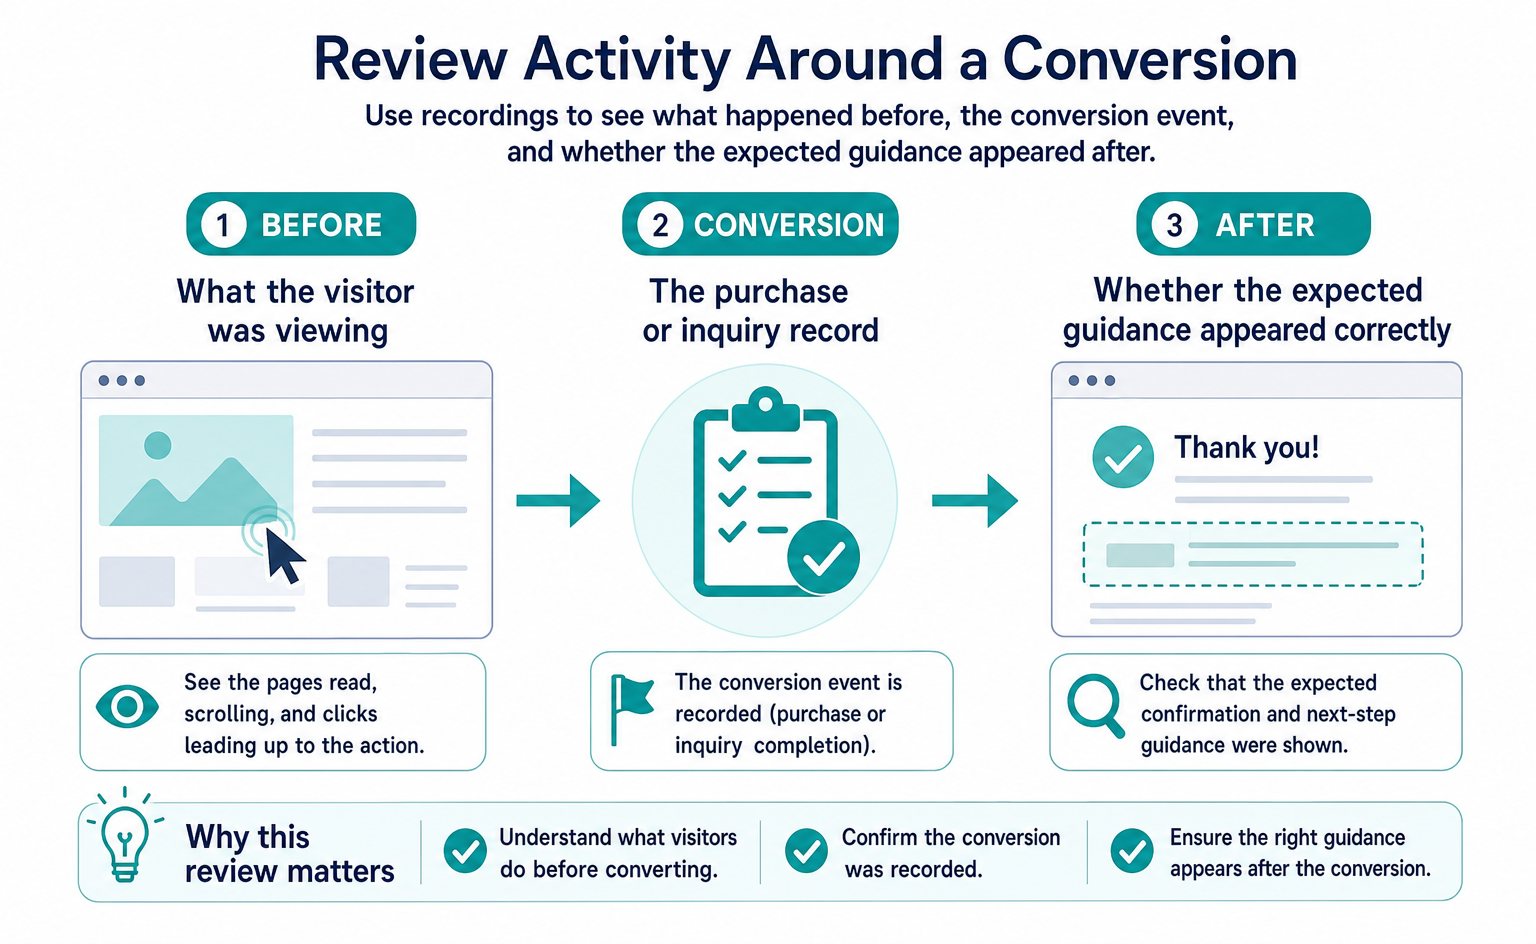
The CV and custom event lists let you play short clips from before and after an action. A custom event is an action your company has chosen to record, such as selecting a product or playing a video. Instead of watching a 20-minute recording from the start, you can review the relevant part.
| Screen | What is listed | What plays |
|---|---|---|
| CV (/cvs) | Conversions recorded by the CV tag, such as completed purchases or registrations | A clip around the conversion |
| Custom Events (カスタムイベント) (/custom_events) | Actions recorded by the custom event tag, such as product selection or video playback | A clip around the event if clip settings specify the number of seconds before and after |
| Users (ユーザー) (/users) | Users linked through the identify tag | Lets you follow multiple sessions for the same user together |
The basic tracking tag is enough to start recording, but counting completed applications requires additional setup, such as a CV tag. One example adds a one-line call to the completion page.
Section 9 of Install the tracking tag explains how to use the three additional tags. If no rows appear on a screen, first check whether the relevant action has been set up for tracking.
One operating routine is to review five recent conversion recordings once a week. Note the pages people read and the places they interacted with just before signing up.
If the same page appears repeatedly, it may contain information people check before applying. However, you cannot conclude that this page alone caused the application. Compare recordings of people who did not apply, using matching conditions.
7. Use heatmaps to see where people click
Under Web Recordings & Improvements (Web録画 & 改善) → UI Improvements (UI改善) (/heatmap), colors show aggregated click and scroll activity. This feature is in beta. Use it to find areas with frequent interaction before searching individual recordings.
Open the target page from the page list, then select a device and period. SP means the smartphone view, and PC means the computer view. Review devices separately because the layout may differ even for the same area.
The background uses a screenshot of the page. If it shows an old design after you change the page, you can recapture it from the screen. Also check the aggregation period so you do not judge old interactions against a new layout.
A dead click is a click on a place where no visible screen change follows. For example, someone may click an image that looks like a button, but nothing opens.
Start by checking which locations have the most recorded activity. The following example lists click counts and other totals for individual locations on the page.
Try the interactive demo below. The article also explains each step in text.
| Column | Meaning |
|---|---|
| Element name (要素名) | Display name assigned in Element Master (要素マスター); automatically detected elements retain their selector |
| Type (種類) | CV button, custom event, dead-click target, or automatically detected |
| Page (ページ) | Page containing the element |
| Clicks, 7 days (クリック (7 日)) | Click count over the past 7 days |
| Dead clicks, 7 days (デッドクリック (7 日)) | Number of clicks that produced no response |
| Unique visitors, 7 days (ユニーク訪問者 (7 日)) | Number of people who clicked |
In the example, the plan comparison image on the pricing page received 96 clicks in seven days. Check whether the same person clicked repeatedly or several people clicked. “Unique visitors” counts people without duplicates.
If the image may look like a link, check the actual page and recordings. Consider making the image a link or adding a nearby button. These numbers help you choose what to fix; they do not promise an improvement the following week.
You can also review totals by location under Settings (設定) → Element Master (要素マスター) (/elements). An “element” is a component of a page, such as a button, image, or heading.
The following examples show situations where clicking may not produce the expected response. Visitors’ thoughts are inferred, so check whether the explanations in the table apply to your own pages.
| Pattern | What the visitor may be thinking | Possible fix |
|---|---|---|
| Clicks an image or illustration | “This must be a button” | Make the image a link or place a button directly below it |
| Clicks blue text without an underline | “It looks like a link” | Make it a link or match its color to the body text |
| Clicks a heading | “This should open”—they think it is an accordion | Make it expandable and collapsible, or remove the arrow |
| Repeatedly presses the submit button | “Nothing is happening” | Change its state immediately after a click, such as by showing a loading indicator |
| Taps the blank space within a card on a smartphone | “I thought the whole card was tappable” | Make the entire card a tap target |
Counts alone do not show what happened before and after a click. Search recordings using that page’s URL, then start by checking the surrounding actions in two or three recordings.
The sequence is to find a busy location in the heatmap, then watch the flow of actions in recordings. Keep the explanation as a hypothesis and try the same actions yourself. If you confirm that nothing happens, tell your developer what kind of change is needed.
8. Investigate errors that block actions
Error Detection lets you review records of failed page operations or communication. Under Web Recordings & Improvements (Web録画 & 改善) → Error Detection (エラー検知), open JS Errors (JS エラー) (/diagnostics/js_errors) or Network Errors (ネットワークエラー) (/diagnostics/network).
| Screen | What is listed | What to check first |
|---|---|---|
| JS Errors (JS エラー) (/diagnostics/js_errors) | Browser-side script errors, with occurrence counts, details, and affected sessions | Start with the most frequent errors. Check whether they cluster around a particular OS or browser |
| Network Errors (ネットワークエラー) (/diagnostics/network) | Failed API requests or external resource loads, with occurrence counts, details, and affected sessions | Start with URLs related to form submissions or payments |
A JS error is a failure in a process running in the browser. A network error is a failure to send or load information. If a form cannot be submitted, check these records as well as the visual design.
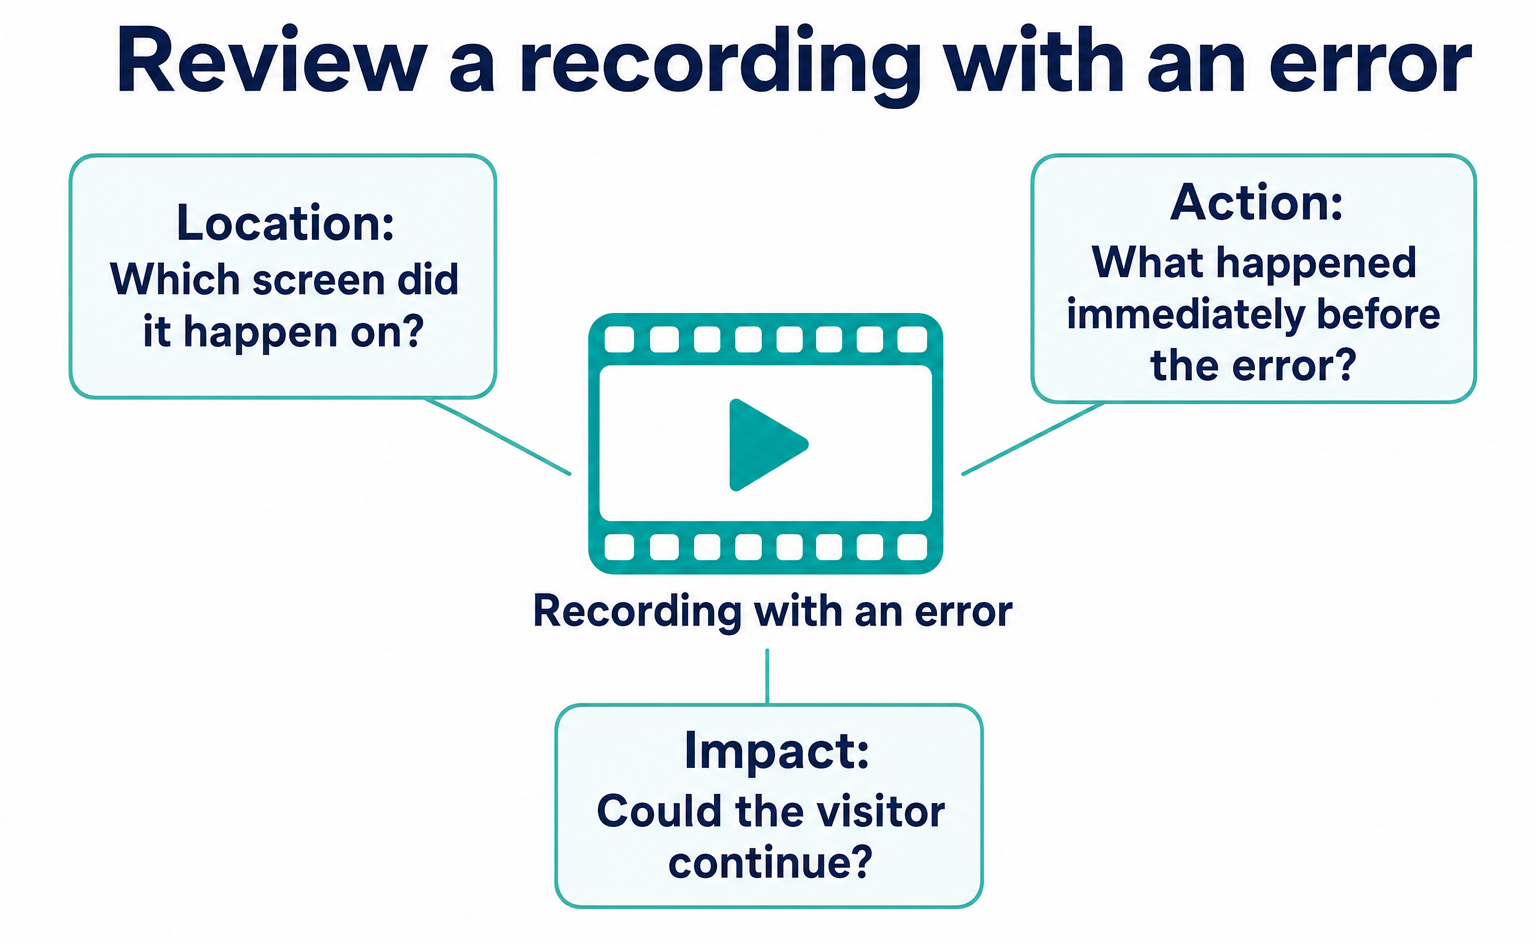
Open frequent errors or those related to submission, then watch the relevant recordings. Give your developer the error details, affected URL, time of the action, and device you checked. If the recording is safe to share, you can include its link too.
9. Do not decide the cause from a few recordings alone
Decide what you want to investigate before choosing recordings. If you have 30 minutes, for example, do not simply open the list from the top without filters. Set conditions and reserve time to record what you observed.
| Misconception | Reality |
|---|---|
| Recordings are useful only if you watch them all | Narrow the conditions and start with 3–5 recordings to find examples of actions. Check broader trends against other records too |
| A page with a high exit rate has a poor UI | Errors, discussed in section 8, or a mismatch between the referrer and landing page, such as an ad destination, are also common causes. Use recordings to investigate the reason before making changes |
| Bot traffic reduces the allowance | It does not. Bots are not recorded and do not consume the allowance |
| Heatmaps make recordings unnecessary | Use heatmaps to find locations and recordings to check actions before and after. Test the explanation as a hypothesis |
| Deleting recordings restores the allowance | It does not. Usage is counted when consumed |
| If usage does not rise, nothing is being recorded | The usage display has an aggregation cache of up to 30 minutes. Recordings themselves are still captured |
| The CV list shows full recordings | The CV list shows clips around conversions. For full recordings, filter the Web Recordings list by With conversions (CV あり) |
Above all, avoid declaring a cause from a small number of recordings. Separate the stages: “We observed this action” and “We will check other visits under the same conditions.” Check whether recordings still exist, not just the displayed totals.
10. Recording allowances and retention periods
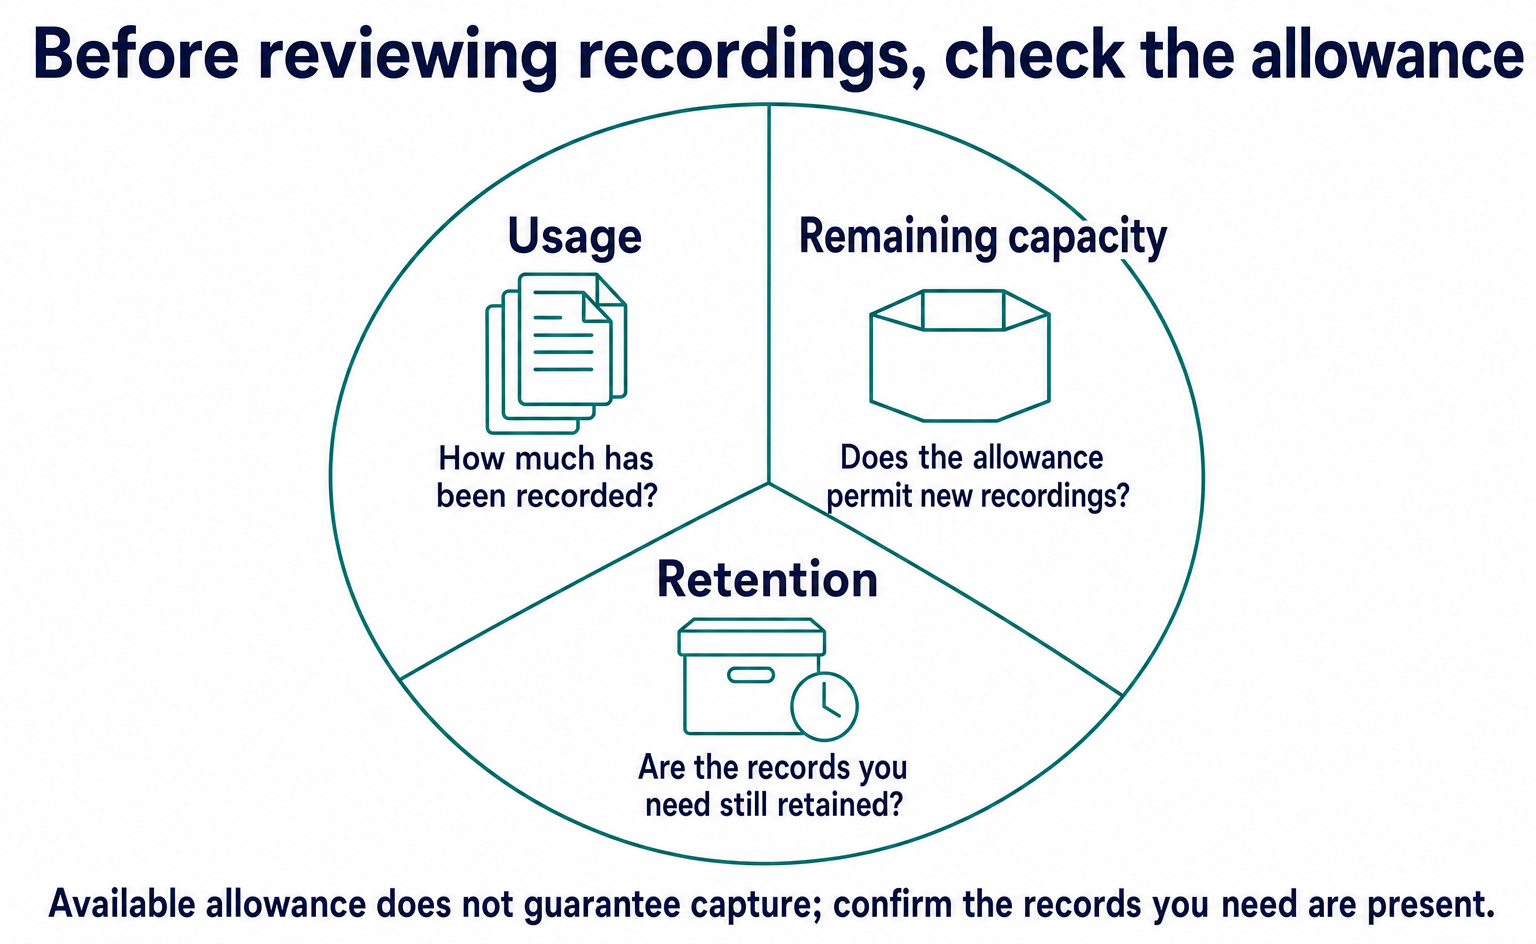
Recording allowances and retention periods depend on your plan. The usage bar at the top of each menu shows This month (今月) for paid plans and Total to date (累計) for the free plan. Check the separate retention column too.
Try the interactive demo below. The article also explains each step in text.
| Plan | Recording allowance | Retention | Monthly price, tax included |
|---|---|---|---|
| free | 1,000 tracked visits in total; no monthly reset | 30 days | ¥0 |
| starter | 10,000 per month | 90 days | ¥2,980 |
| growth | 40,000 per month | 180 days | ¥9,800 |
| pro | 150,000 per month | 365 days | ¥29,800 |
The free plan allows 1,000 tracked visits in total. Consider Starter or another paid plan if you need a recurring monthly allowance. Every plan allows unlimited registered domains.
The pricing table also lists overage rates, but recording is subject to a stop at the limit. Do not assume it will continue automatically. Check the on-screen guidance as you approach the limit. Paying for six months upfront gives a 15% discount; paying annually upfront gives a 30% discount [3].
Keep these three points in mind when checking usage, display timing, and visitor classification.
- Allowances are consumption-based. Once a tracked visit has been counted, deleting its recording data does not restore that allowance.
- The usage display has an aggregation cache of up to 30 minutes. Even if the number does not rise immediately after a recording, the recording itself is still captured.
- Bots do not consume the allowance. Even sites with heavy crawler traffic do not need to worry about bots using up recording capacity.
The bar changes to a warning color above 80%. At 100%, new recordings stop. If a card is already registered, an upgrade takes effect immediately through the interface. The price difference for the remaining period is used for billing or balance adjustments [3].
You can also downgrade. You may cancel at any time and continue using the service until the end of the paid period, but there are no prorated refunds. Before changing plans, check the retention period you need and the details of your next bill.
11. What to check when visits are not recorded
Check tag installation, bot classification, and the allowance, in that order. Investigate missing visit records separately from recordings that simply will not play.
| Order | Check | Where to look |
|---|---|---|
| 1 | Is the tag installed in <head>? |
Search the page source for t.js. Compare the key under Settings (設定) → Tracking Tag (計測タグ) with the k= value |
| 2 | Was the visit classified as a bot? | In Web Recordings, set the Type (種別) filter to Bot and check whether your own visit is included |
| 3 | Has the recording allowance been exceeded? | Remaining capacity in the allowance bar |
When checking the tag, look for code removed by a theme change or similar update. If you installed it through GTM or another tool, confirm that it has been published there too. Next, check whether a visit at the same time was classified as a bot.
Finally, check the usage bar. If you have used the free plan’s total allowance of 1,000 tracked visits, it will not reset the next month. Deleting recordings will not increase the remaining amount either.
If the problem remains, use Ask AI (AI に質問) in the header. Provide the site URL, tag location, and the date and time you checked. Also say whether the play button is disabled or the visit has no row in the list at all.
See Install the tracking tag for installation and verification steps. Sharing the exact URL helps avoid confusion caused by investigating a different page.
12. Steps to find improvements
Start by checking the visits you want to investigate, frequently clicked locations, and actions before an application. The following three tasks are examples of where to begin. Record what you observe, then decide what to fix and what to check next.
- In Web Recordings (Web録画), filter by “Via AI (AI 経由) × With conversions (CV あり) × Past 30 days (過去 30 日)” and play the first three recordings, following recipe 1. Review the actions of people who arrived from AI and signed up.
- In UI Improvements (UI改善), choose one element with many dead clicks and watch two recordings of that page, using the back-and-forth process in section 7. This gives you one location to fix this week.
- Add the CV tag to the completion page and build a weekly habit of watching the clips immediately before conversions in the CV list, as described in section 6.
You can summarize the observed actions, proposed explanation, and planned response in about three lines. The following is an illustrative example. Replace its counts and URL with the values you actually checked.
Among people who landed on /pricing in the past 30 days, four of the five recordings reviewed for form abandonment showed a pattern of clicking the plan comparison image after mistaking it for a button, going back, and leaving (recording link: …). This week, we will add a “Compare plans” button below the image. Next week, we will compare conversion rates under the same conditions and report the results.
Write the numbers, observed actions, planned response, and next check in that order. In this example, “mistaking it for a button” is an inference. Explain it separately from the clicks visible in the recordings. Keeping the number of recordings reviewed also helps you assess whether the finding can be treated as a broader trend.
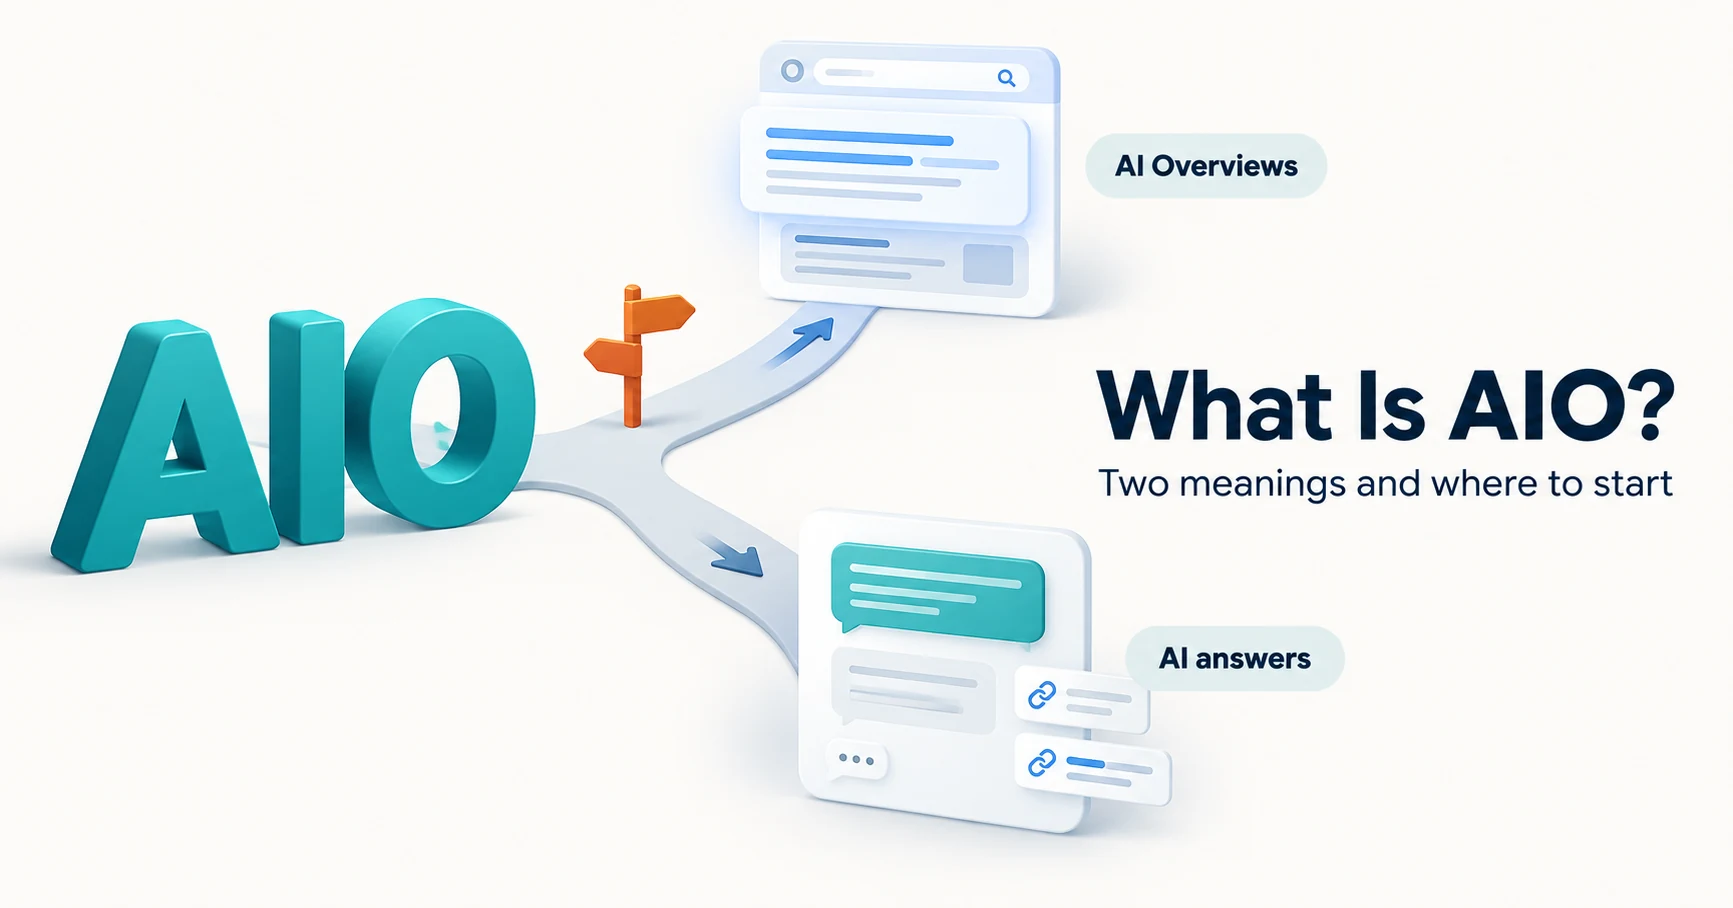
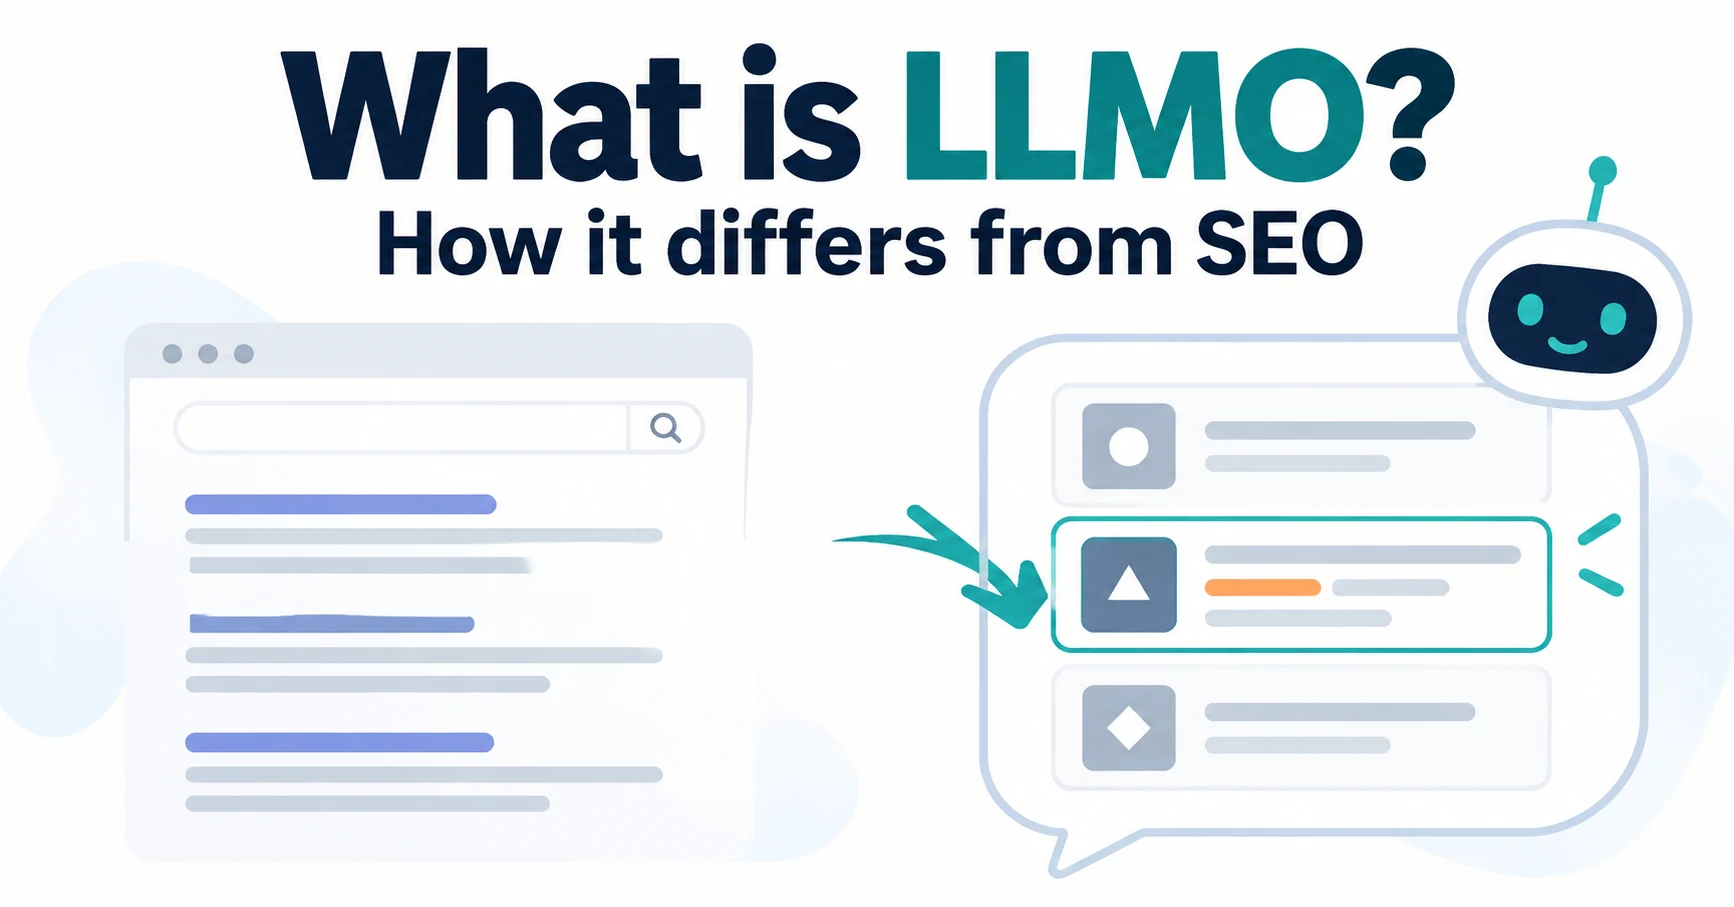
If you are investigating people who arrive from AI answers, see What is AIO? and What is LLMO? for ways to measure appearances and visits. Recordings show what people did after reaching your site. Track this separately from how often your site appeared in AI answers.
Summary
Filter your recordings, then keep observed actions separate from hypotheses about their causes. Use heatmaps and error records alongside them to choose where to make changes.
- Web Recordings (Web録画) (/recordings) has a nine-column list. Referrer (リファラー) and Type (種別) help identify visits from AI directly in the list. The play button opens the player on the right.
- Visitors are automatically classified as human, AI agent, or bot. Bots are not recorded and do not consume the allowance.
- Combine filters around “who × where × what they did” to narrow the list to a few relevant sessions. “Via AI (AI 経由) × With conversions (CV あり)” is the first recipe.
- CVs and custom events play only clips around the action. Find dead clicks in the element totals under UI Improvements (UI改善) (/heatmap), then use recordings to investigate the reason.
- Allowances are 1,000 in total for free, 10,000 per month for starter, 40,000 per month for growth, and 150,000 per month for pro. Retention periods are 30, 90, 180, and 365 days. Usage is consumption-based, and its display may lag by up to 30 minutes.
- If visits are not being recorded, check the tag, bot classification, and allowance, in that order.
FAQ
- Q. How long are recordings kept?
- Free keeps recordings for 30 days, Starter for 90 days, Growth for 180 days, and Pro for 365 days. Recordings are deleted in sequence after their retention period expires. Creating a sharing link does not extend that period, so review the recordings you need before it ends.
- Q. Do bot visits use the recording allowance?
- Visits classified as bots are not recorded and do not use the allowance. AI that acts on a person’s behalf is eligible for recording. However, some actions cannot be captured, such as when the tracking tag does not run.
- Q. Will passwords or card numbers appear in recordings?
- The default settings hide text entered into fields. Card numbers and other information displayed in the page’s main content need a separate check. Go to Settings (設定) → Privacy (プライバシー), select the relevant areas, and exclude any necessary content from recordings.
- Q. Why can’t I play a recording after filtering for “With conversions”?
- The CV list plays only the moments before and after a purchase or inquiry. To see the full visit, select With conversions (CV あり) in Web Recordings (Web録画). The recording must still exist and be within its retention period.
- Q. Why isn’t the heatmap appearing?
- UI Improvements (UI改善) is a beta feature. Check that the target page has the tracking tag and that visits have been recorded. You can recapture the page image used as the background from the screen.
- Q. How many live recordings can I watch at once?
- The number you can watch at the same time is limited by your plan. You can also open a chat with the visitor from the live viewing screen.
- Q. The usage number isn’t increasing. Does that mean visits aren’t being recorded?
- The usage display can lag by up to 30 minutes. Also check whether new visits appear in the recording list. If the number still does not increase after waiting, check the tag, visitor classification, and remaining allowance, in that order.
- Q. Does deleting recordings restore my allowance?
- No. Paid plans renew their allowance each month, but the free allowance is a lifetime total. Consider changing plans if you need more capacity.
Sources
- [1] AgentSignal 使い方ガイド (セッション録画・ヒートマップ) (AgentSignal) — accessed 2026-09
- [2] 計測タグ (t.js) を設置する (AgentSignal) — accessed 2026-09
- [3] AgentSignal 料金プラン (AgentSignal) — accessed 2026-09
- [4] rrweb — record and replay the web (rrweb (GitHub)) — accessed 2026-09
- [5] Referer — HTTP (MDN Web Docs) — accessed 2026-09
About the author
Shogo MizushimaCEO of kairos Inc. / AgentSignal Developer
Develops AgentSignal, a tool for measuring AI crawler visits and AI-referred traffic, and diagnosing AIO readiness. Writes about measurement and practical improvements for AI search using observed data.
Related articles
Measurement and site improvement
What Are AI Crawlers? Why Blocking GPTBot Doesn’t Remove You from ChatGPT Search
AI crawlers are programs AI companies use to read public web pages. Learn how GPTBot differs from OAI-SearchBot, how Google-Extended works, why visits can continue after a robots.txt block and how to choose settings by purpose.
Published
AIO and AI search
What Is AIO? Its Two Meanings and Where to Start with AI Optimization
AIO has two meanings: work to get your company featured in AI answers, and Google Search’s AI Overviews. Learn how it relates to SEO, what to confirm in a proposal, what Search Console and Bing reports show, and your first tasks.
Published
AIO and AI search
What Is LLMO? How It Differs from SEO and Why Some Say It Is Pointless
LLMO is the work of helping answers from ChatGPT and other AI find and accurately describe your company. Learn how it differs from SEO, why some call it pointless, how E-E-A-T relates, how to measure results and what to do in the first month.
Published